Our company in Numbers
Here are the most frequently asked questions among our inquiries.
The data provided is from from January 2023 to December 2025. Details vary by year.
Please refer to the following FAQ, which will provide a general image of our business operations.
What is the track record of the companies you dealt with?
Number of customers we dealt with during the year
348 companies
As we cannot disclose specific company names, we hereby provide figures instead for your information. The number of customers we dealt with during one year (348 companies) means the number of customers we transacted directly (from January 2023 to December 2025 ). Indirect transactions through inspection agencies are counted as the number of inspection agencies outsourced to us.
Clients of lectures and seminars are not included in the calculation (nb: the same applies to the following statistics).
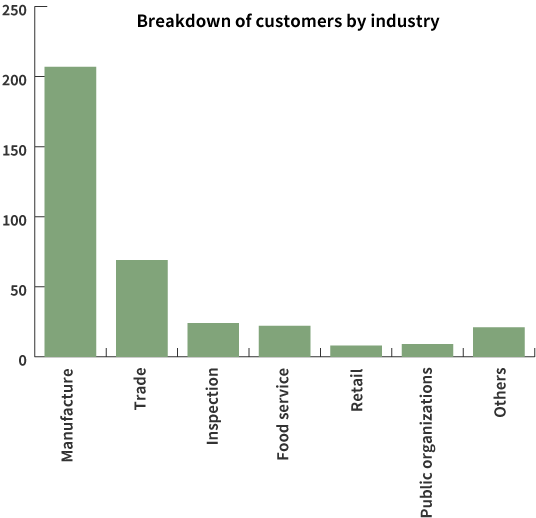
Breakdown by industry
188 manufacturers, 74 trading companies, 29 inspection agencies, 13 food service companies, 11 retailers, 6 public organizations, 27 others (IT companies, consulting companies, planning companies, law firms, translation firms, etc.)
This is a breakdown by industry sectors of customers with whom we have had direct business transactions (Jan 2023 - Dec 2025) (note: Foreign companies with plants abroad manufacturing food products for Japan are included in the manufacturers).
Although it varies from year to year, the majority of the requests are received directly from manufacturers.
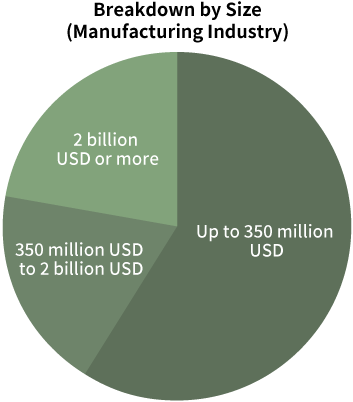
Breakdown by Size (Manufacturing Industry)
Annual sales: up to 350 million USD: 103 companies*, 350 million USD to 2 billion USD: 39 companies, 2 billion USD or more: 46 companies.
This chart shows a breakdown by size of the manufacturers (Jan 2023 - Dec 2025) among our customers we dealt with directly.
Since sales amount (of clients) vary greatly by industry, here only the manufacturing industry is included in the breakdown.
*Note: Companies with unknown annual (about half) sales are included in the "up to 350 million USD" category.
In which food categories have you the most working experience?
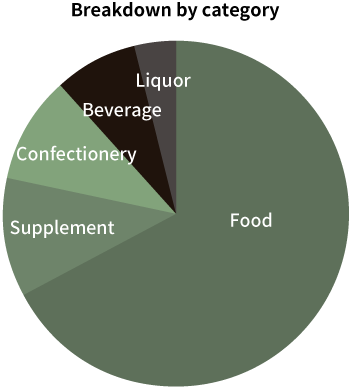
Breakdown by category
166 companies for foods, 37 companies for supplements, 29 companies for confectioneries, 24 companies for beverages, 9 companies for liquors
The chart shows a breakdown by category of the main food products handled by manufacturing and trading companies (Jan 2023 - Dec 2025) among the customers with whom we have direct transactions.
The "Food" category includes mainly processed foods such as processed agricultural, marine, and livestock products, seasonings, frozen foods, and instant foods.
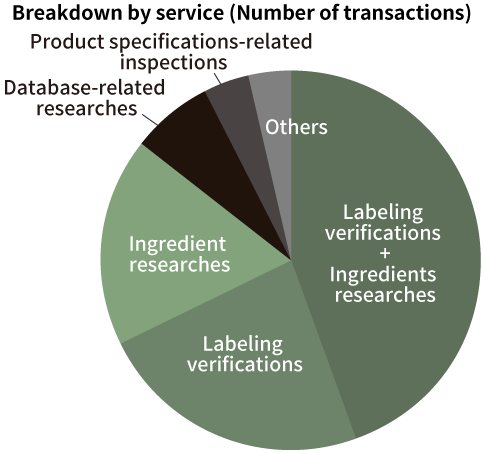
Breakdown by service
1359 labeling verifications + ingredients researches, 796 labeling verifications, 452 ingredient researches, 92 database-related researches, 91 product specifications-related inspections, 91 others
The chart shows a breakdown of services we provided (Jan 2023 - Dec 2025).
The number of transactions is counted as the number of orders from customers during the calculation period.
Database-related services include the ones related to systems for researches for usage standards of additives, etc..
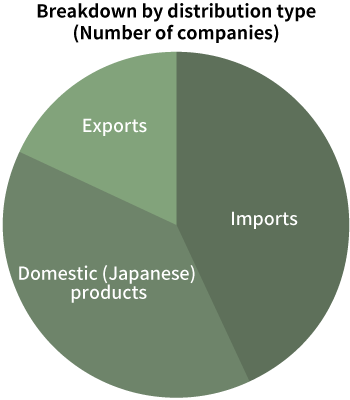
Breakdown by distribution type
158 companies for imports, 115 companies for domestic(Japanese) products, 75 companies for exports
This chart shows a breakdown of services by distribution type we provided (Jan 2023 - Dec 2025).
In cases of requests from a single company with two or more distribution types, we count only the distribution type with the highest number of transactions among them.
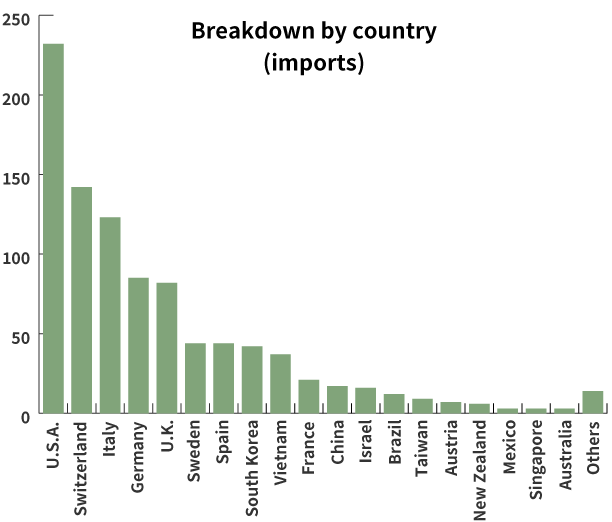
Breakdown by country (imports)
U.S.A. 193, Italy 124, Switzerland 97, Germany 78, U.K. 60, Sweden 56, Spain 42, Vietnam 35, South Korea 33, ... (omitted), Total 24 countries
The chart shows a breakdown by country of the number of transactions (number of times our service was used) of food products imported to Japan among customers with direct transactions (Jan 2023 - Dec 2025).
Although it varies from year to year, North America, Europe, and East Asia are the most common locations of client companies.
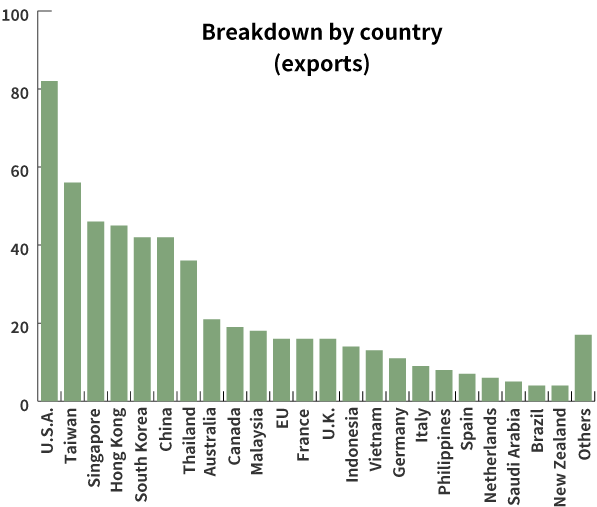
Breakdown by country (exports)
U.S.A. 95, South Korea 46, Taiwan 40, Singapore 28, Hong Kong 26, U.K. 25, China 22, Germany 19, Australia 17, Thailand 13, ...(omitted), Total 31 countries
The chart shows a breakdown of the number of transactions (number of our services used) by country or region for the overseas inspection (Jan 2023 - Dec 2025).
Although it varies from year to year, most requests are targeted to North America, Southeast Asia, East Asia, and Oceania as export destinations from Japan.
Who is in charge of the research?
About our team of specialists
Labelbank has approximately 15 specialized staff in charge of its ingredient and food labeling researches.
Their areas of expertise are biology, nutrition, and linguistics, and is backed up by several qualifications recognized in Japan (Food Labeling Consultant, National registered dietitian, etc.).
Please refer to the "Experts" page for a glimpse at our team members.
We will continue to work on improving the quality of our research work so that it can be constantly enhanced.
If you have any other questions about our company, please do not hesitate to contact us by clicking here.